Introduction
Dashboards offer a place to visualize data from records or cases in a single view. These views help you monitor what's happening across workflows within your team.
Components
There are three types of components on the dashboard:
Charts: created from your records data to visualize records with applied filters in multiple chart types for an aggregate view
Case Views: filtered view of cases or case summary data (i.e. MTTR, MTTA)
Notes: context to provide alongside the charts or lists with Markdown support
Configuring dashboards
Create a dashboard
Click New Dashboard
Name the dashboard (this must be unique and can be edited at any time)
Add a note to the dashboard
Notes let you add explanations and context to your dashboard
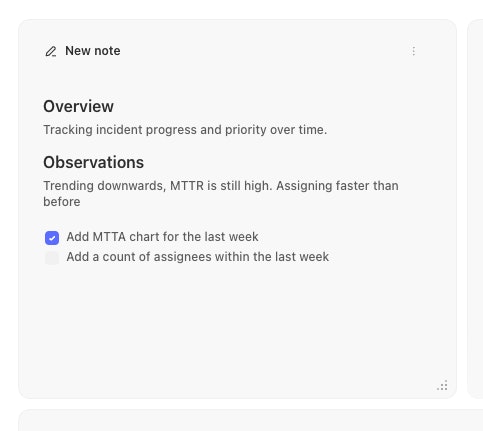
Dashboard Note
Add a Case view to the dashboard
Case views allow you to create some basic charts based on a saved case view or a new search. To create a case view, follow these steps.
Add a new Case view element to the dashboard
Name the element
Choose to use a saved cases view or use the search filters to query for the data you want
Select the display option for how you want to visualise the results
MTTR & MTTA Case views
Case views include the option to display and graph MTTR (mean time to resolve) & MTTA (mean time to assign) values for cases within a team.
The time to resolve value for a case is calculated by the difference between the timestamps of when a case was opened (created_at) and when it is closed (resolved_at). Similarly, the time to assign value for a case is calculated by the difference between the time the case was opened (created_at) and a user first being assigned to the case (created_at on the first user assigned activity record).
Add a Records chart visualization to the dashboard
You can also add Records graphs into your dashboard to add visualizations of data captured via Records