Organizations are increasingly turning to cloud-based SIEM solutions. It makes total sense: bandwidth is prevalent, storage in the cloud is cheap, sizing is no longer a necessary concern before beginning, and compute resources for intense queries are abstracted from users. Engineers and analysts are finally able to get the most out of their data without spending more than half their days just keeping it working... and I've been there dealing with influxes of logs and rolling database tables every two days!
In 2019, Microsoft announced Azure Sentinel and it's since grown exponentially in capability and community. The ability to flip a switch and have a detection platform that incorporates some of the most valuable data in the Azure ecosystem like Microsoft 365 is unmatched. Azure Sentinel proves itself to both small businesses and data heavily organizations at the same time.
Tines is a no-code automation platform that helps security teams get the most out of Azure Sentinel. In this blog we'll discuss working with alerts generated by detections, querying the Log Analytics backend of Azure Sentinel with data from other sources, and adding threat intelligence indicators leveraging Azure Sentinel's watchlist.
Authentication
Our love (there's a small bit of fist-shaking in there too) for the Microsoft Graph API runs deep. It provides a singular point to interact with a large majority of Microsoft cloud services. Step one is interacting with it is always getting the correct permissions for access.
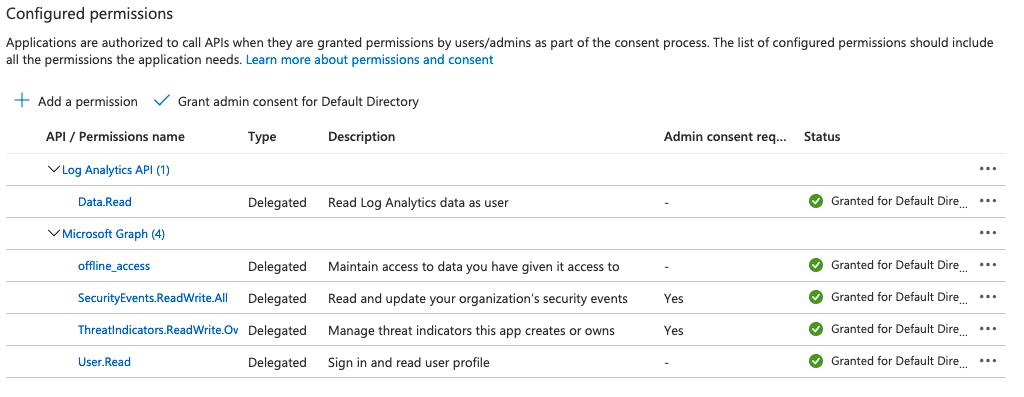
We've written previously about how to set up authentication to Microsoft resources (https://www.tines.io/blog/updated-microsoft-graph-security-automation). This will follow the same process, except we will need to include the additional delegated API scopes for everything we'll go over:
Microsoft Graph's SecurityEvents.ReadWrite.All - used for setting up the alerts webhook and reading alerts.
Microsoft Graph's ThreatIndicators.ReadWrite.OwnedBy - used for creating threat indicators in Azure Sentinel.
Microsoft Graph's offline_access - provides long-lasting OAuth access.
Log Analytics API's Data.Read - used for querying Log Analytics data.
Webhook Setup
We love to utilize the Graph API to set up a subscription to receive notifications every time phishing report mailboxes receive and analyze URLs and attachments submitted. Similarly, Microsoft allows users to set up subscriptions to new alerts seen in Azure Sentinel. While it's entirely possible to also poll for alerts, creating a webhook helps lower the time to action an alert rather than waiting for the next polling interval.
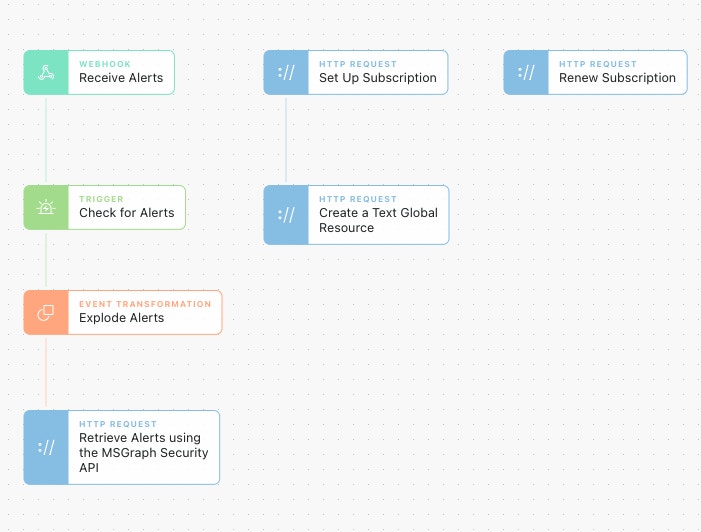
To set up the webhook subscription in Tines requires a handful of purpose-built Actions to:
Create the webhook subscription.
Configure the webhook to receive alert notifications and look up the verbose alert details.
Renew the subscription so it doesn't expire. Configure this Action to run daily utilizing the Action 'Schedules' feature to keep the subscription active.
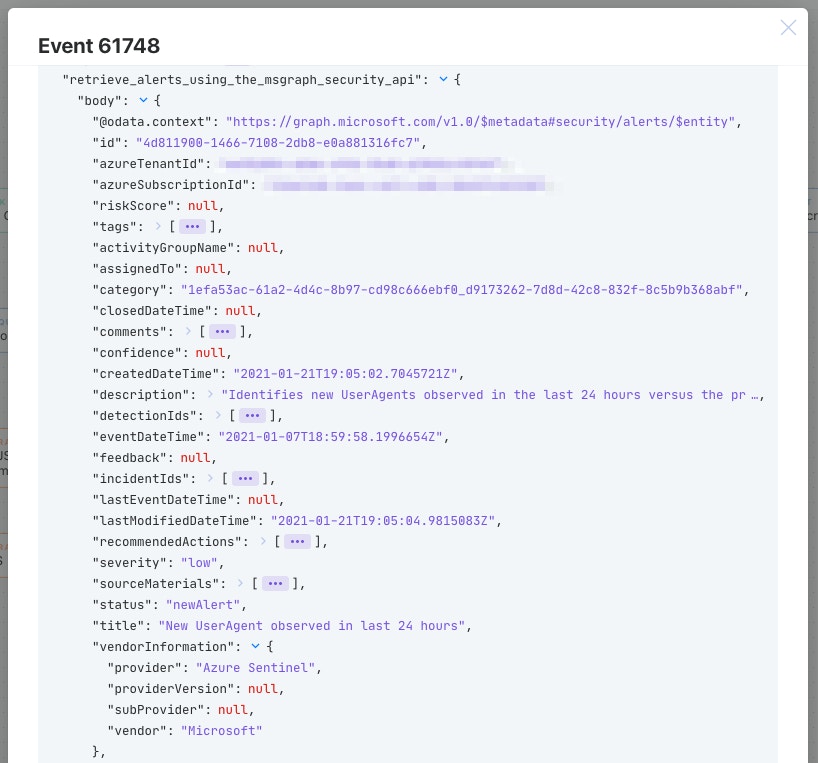
Alerts retrieved will be ready to work with, analyze, and document in case management platforms like Jira or TheHive!
Query Log Analytics
The first step of many drive-by questions or reactions to intelligence is to ask the SIEM what it knows. It's a typical workflow that we see implemented no matter what the SIEM is and one that lends itself to utilizing the Send to Story Action in Tines.
Send to Story allows for compartmentalized stories to be created and reused from other stories in their workflows. Simply, in Tines, we can send a query to an Action from any Story and receive all of the query results in a standard workable format.
Azure Log Analytics is the data store for Azure Sentinel and offers powerful capabilities to interact with data. Log Analytics utilizes the powerful Kusto Query Language which provides almost unlimited query capabilities. Log Analytics also offers an easy-to-use API to enable teams to interact with it from Tines.
Unfortunately, Azure Log Analytics is not part of the Microsoft Graph API at this time. Luckily, our existing authentication credentials can be reused in an HTTP Request Action credential instead of an OAuth credential.
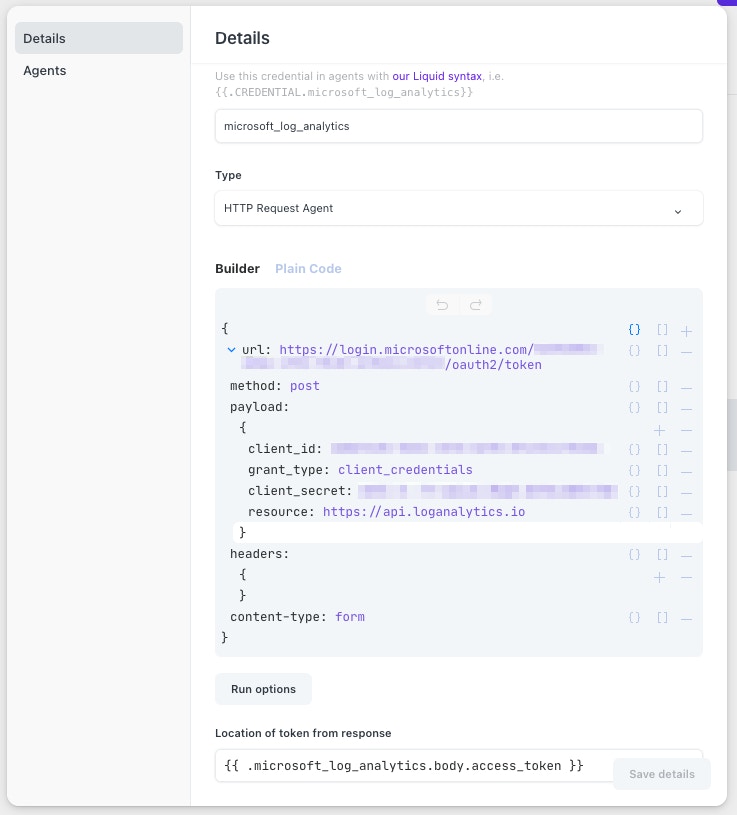
Allow this Service Principal access to your Log Analytics workspace as well. Doing so is outlined in this Microsoft article.
Once the credential has been created, we can start making queries against Log Analytics! Check out this simple Storyboard.
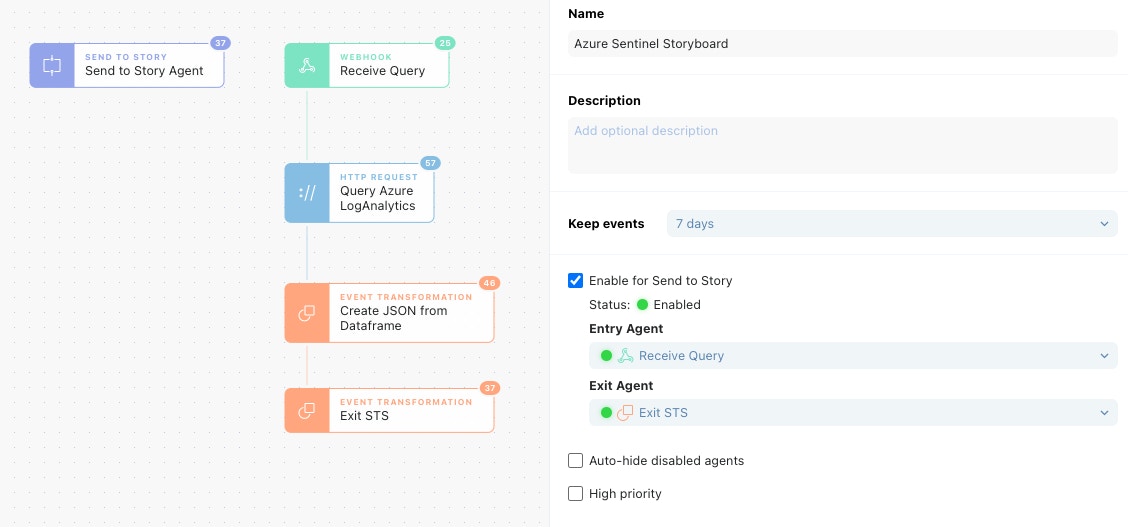
In our Send to Story Action, we can put in a Kusto formatted query. This Send to Story Action could be from any other Story; it's just easy to have on the same Storyboard a Send to Story Action for testing out functionality. Our query will look for Root console logins from AWS CloudTrail logs and map some of the fields in the events to normalized field names.
When the "Query Azure Log Analytics" Action is executed with the query, we can look in the Action events to see what data we got back!
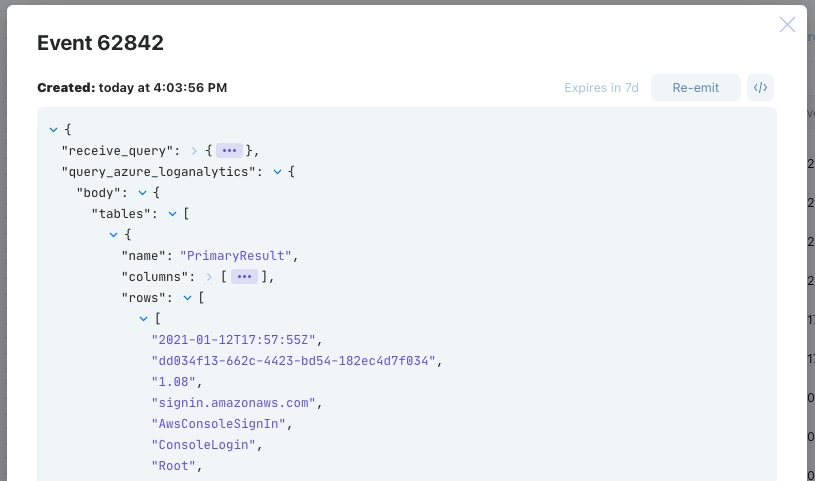
Azure Log Analytics returns data in the form of a Dataframe (https://pandas.pydata.org/docs/user_guide/dsintro.html#dataframe) which splits the result into columns and rows. Dataframes are used commonly for statistical analysis applications but are becoming increasingly more common in other products. It can be quite daunting to reconstruct this data into a simpler structure. In the consequent Action "Create JSON from Dataframe" we have utilized Liquid filters to transform the Dataframe into a clearer JSON object.
After running the event through that Liquid filter, we then exit our story with clear results that can be investigated easily.

Submitting Threat Intelligence
Azure Sentinel's feature set has snowballed since its introduction (all without needing to manage upgrades), and the recent addition of the ability to submit custom threat indicators to Azure Sentinel is no different. Good threat intelligence indicators help teams separate the noise from the signal in order to take action on what matters.
Another common use case we see at Tines is collecting, distributing, and actioning threat indicators that teams gather. While MISP and other intelligence sources can provide a bulk of updates, there is always the need to submit indicators in an ad hoc fashion to enable teams to react quickly to new events.
Utilizing our original OAuth credential, we can use the (currently 'beta') feature of the Graph API to submit new threat intelligence indicators. As a bonus, this is the same API used to submit indicators to Microsoft Defender Advanced Threat Protection as well!
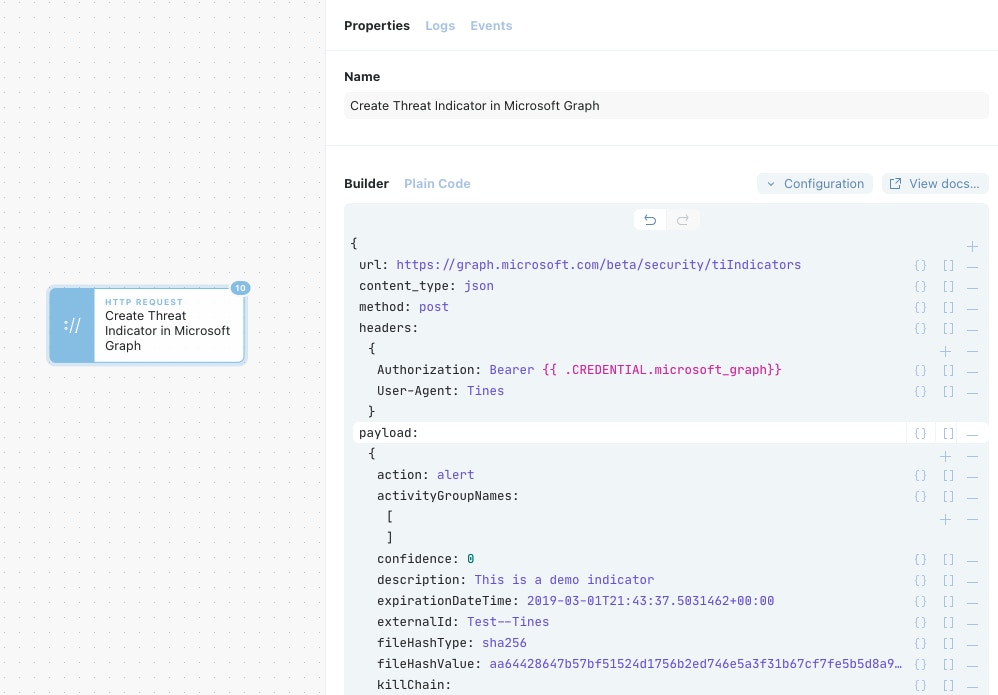
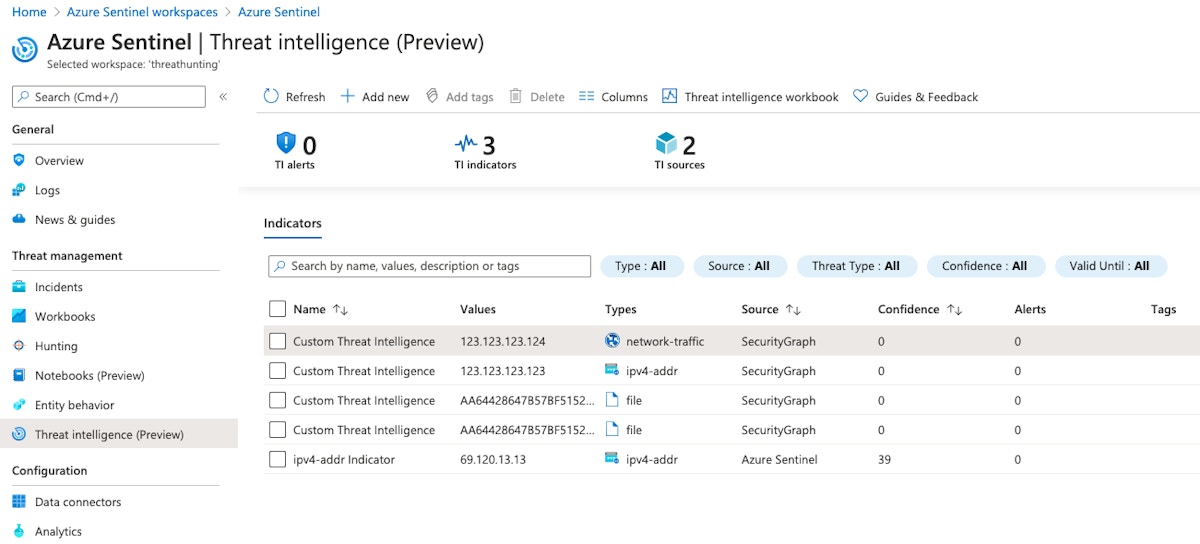
The new indicators will appear in the "Threat Intelligence (Preview)" panel of Azure Sentinel and can be correlated against all data sources being brought into Azure Sentinel.
A Friendly Pairing
Utilizing Tines with Azure Sentinel enables organizations to orchestrate powerful workflows that security teams need. As covered in-depth above, Azure Sentinel and security Graph API alerts were received by a webhook, queries for Log Analytics were made, and Threat Intelligence indicators were added to Sentinel. With this knowledge, teams can extend any of these workflows out to their other tools that Tines supports like ticketing systems, EDR platforms, and threat intelligence providers.
Example Stories can be found here.