In the digital realm, we, as defenders, are too often on the back foot. We hunt for and react to an attacker’s movements, but what if we could direct them for a change and automate what happens next? Attackers attempt to gain a foothold and continuously seek to pivot ever deeper into networks and systems, but what if we could tripwire certain paths? We could magnify our detection capabilities and entice attackers into betraying themselves. Breaking the attacker cycle in the earliest phases of the kill-chain is crucial for regaining the upper hand and reducing an attacker’s dwell time (the industry average is sadly 280 days). So why can’t we detect attackers in minutes or seconds? Well, we can. This is, after all, your territory, a space in which you are best positioned to observe and control.
The concept of honeypots has been around for a while but they have traditionally suffered challenges relating to deployment, noisiness, and a lack of automated incident response. What if we could improve the Signal-to-Noise (SNR) ratio, simplify deployment and management, and also intelligently automate our incident response? What if we could enrich our understanding of an incident and then take the appropriate actions automatically yet gate them with some human supervision? If we didn't need to administer the honeypots and could simply and strategically deploy them to our clouds or local networks, then life would be much easier! But what if we also could sprinkle ‘honeytokens’ into our builds, deploys, file shares, or even sensitive documents? If an attacker finds seemingly high-value API keys, can they resist not trying them?
This is where Thinkst Canary tools enters the picture as the simplest yet most powerful breach detection and deception technology there is. Here we will combine Canary tools with Tines, a defender’s match made in Infosec heaven! By combining both platforms you can balance out both sides of the equation resulting in high fidelity breach detection coupled with security orchestration and automated response that leverage your existing platforms and tools.

Canary Tools dashboard with a critical alert, what next?
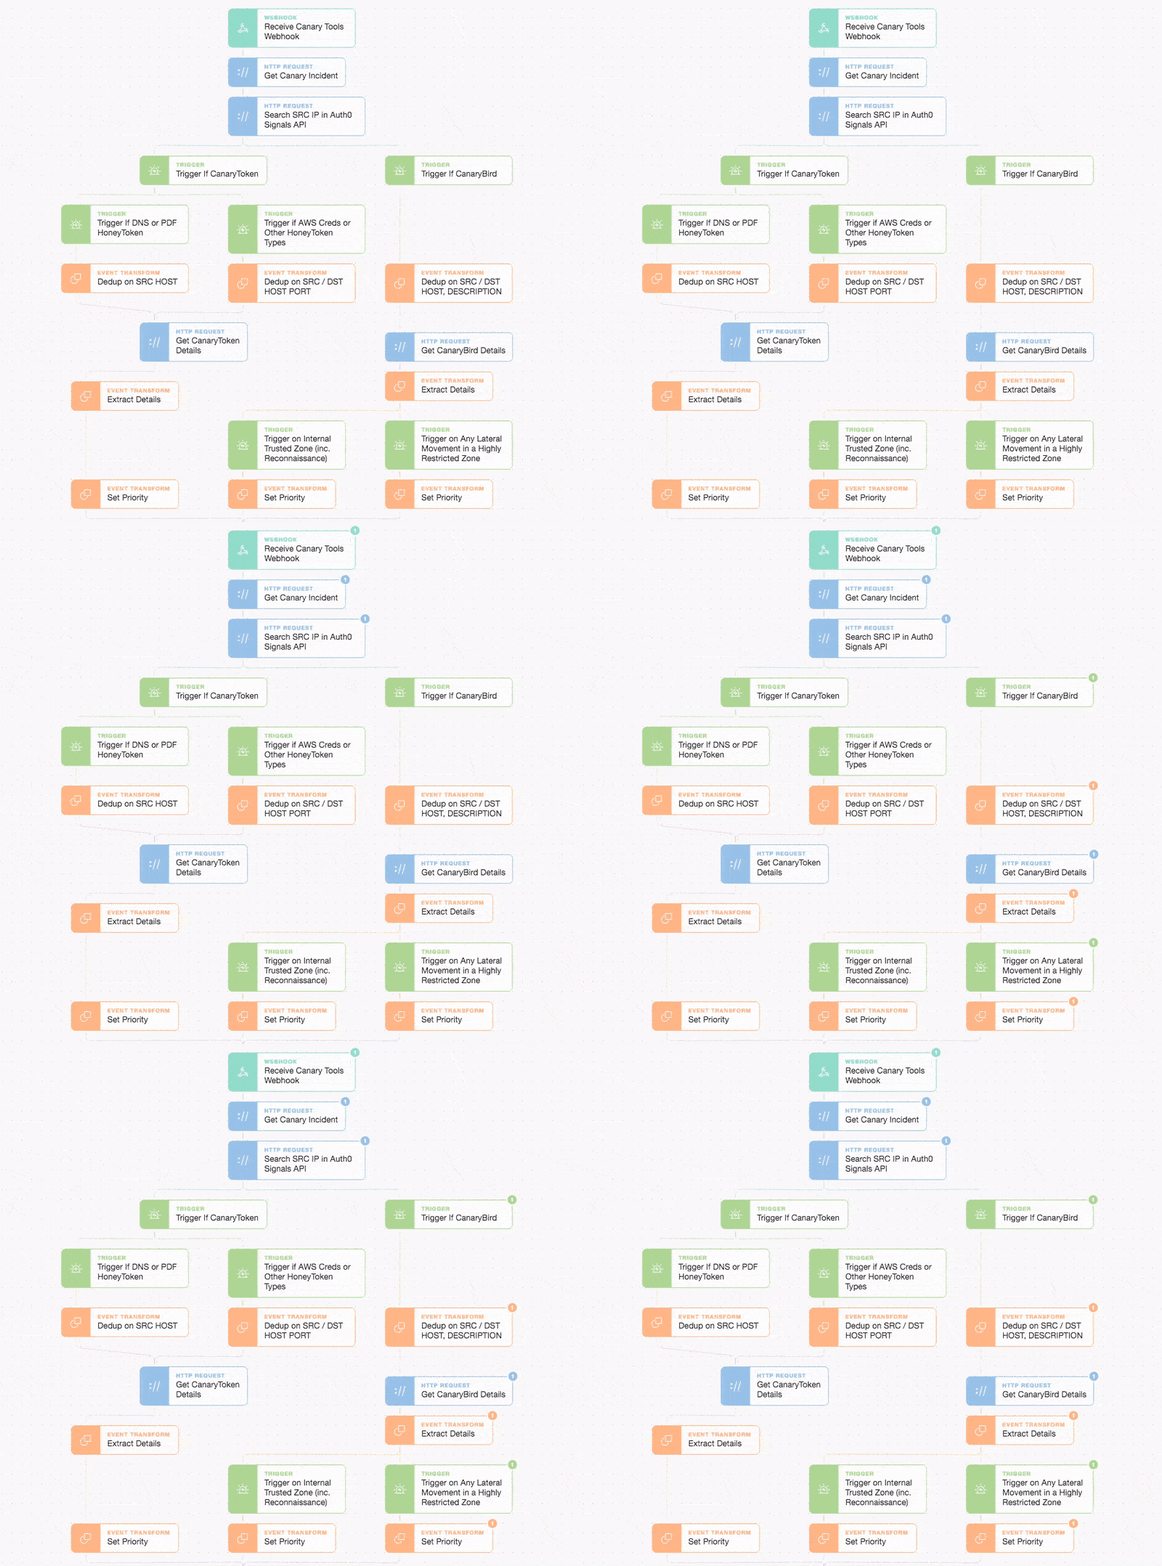
Let's see how we can rapidly and automatically respond to high-fidelity IoCs (Indicators of Compromise) or IoAs (Indicators of Attack) across differing zones in your organization. Whether it’s cloud-based systems or on-premises devices, an attacker must engage with their targets (or intermediate systems) in some manner: be it by reading, writing, or executing some data across a channel. This is where we'll home in on them with our canary lures and tailored tripwires by placing them strategically in restricted or trusted zones. Our basic automation Story is below:

Main Story Overview: Simple logic, easily extended with ‘drag and drop’ blocks
Whether it’s a cloud, virtual, or an on-premises canary, we can configure a ‘bird’ to listen on well-known or custom ports, like for example, one that happens to be a well-known PostgreSQL database port TCP 5432. We will also tell the canary to emulate a webserver login on TCP 8080 (with a built-in basic HTTP authentication service) and then additionally offer an SMB share (below) with some juicy and enticing documents (which also happen to include honeytokens!) My personal favorite is a “temp” directory with AWS honeytoken credentials (or an “.aws” directory in a user or service account path).

(SMB share which you can configure, modify, and easily augment!)
# Note: Temporary contractor access for cloud migration
[default]
aws_access_key_id = AKIAWXGEOMJLZXNKCZ4Y
aws_secret_access_key = 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
region=us-east-1
output=json
Note: Feel free to try the credentials above
Not only do we want to get alerts about any unauthorized access, but our honeytokens can even reveal surprising additional locations or proxy hosts used by attackers. We can hide all manner of honeytokens in source code, database records, configuration files, or other sensitive locations... but of course ensure your internal teams know not to touch them (to avoid false positives)! For the moment though let’s focus on TCP 5432.
Our canary is now listening on TCP ports (139, 445, 5432, and 8080) which should not be accessible from outside our restricted segment. No actions or machines should ever attempt to connect to them locally so when our canary observes traffic or interactivity on these ports, we know we have a problem worth investigating. If an attacker gains access to a valid host or service on our restricted segment, he or she will begin to perform discovery and enumerate useful or interesting services, trip our canary, and give themselves away! This is how we get our high-fidelity *and* high-value signal from the noise! We can also whitelist our own security or asset scanning services so *any* other traffic to our canaries, especially interactive sessions, means we need to investigate and respond quickly.
We could even put canaries on trusted employee segments or in satellite offices to observe and generate lower priority signals, signals that are usually a precursor to future attacks. Our canaries can act as all manner of devices, not just well-known servers and services, but also routers, switches, and even storage devices or ICS / SCADA modbus interfaces.
Once an incident fires, Canary tools sends us a webhook and we begin our enrichment and response automation. Let’s trigger an incident by connecting to TCP port 5432 on our canary in the “restricted_zone” and watch as we automatically enrich, extract, and prioritize our incident.

Event propagates through our story logic and sets priority
First, we get all the incident details and enrich our knowledge about the source IP in the incident. If the attacker source IP is not from the local ‘restricted_zone’ subnet then perhaps someone changed the firewall rules, ACLs, or security groups (which is in itself a bad thing if we did not know about it!). We also separate our canarytokens from our canary ‘birds’ to simplify how we deal with each type of sensor. We can even treat individual canarytoken types differently e.g. DNS, PDF, AWS-ID, etc.
Here we also respond slightly differently depending upon the priority we set per zone. We can decide priority based upon all manner of attributes such as a custom note, flock ID, subnet, or other fields (see the Canary Tools API). We’re using the simple ‘note’ field containing the text “restricted_zone” which we set during deployment and it can be easily updated via the API.
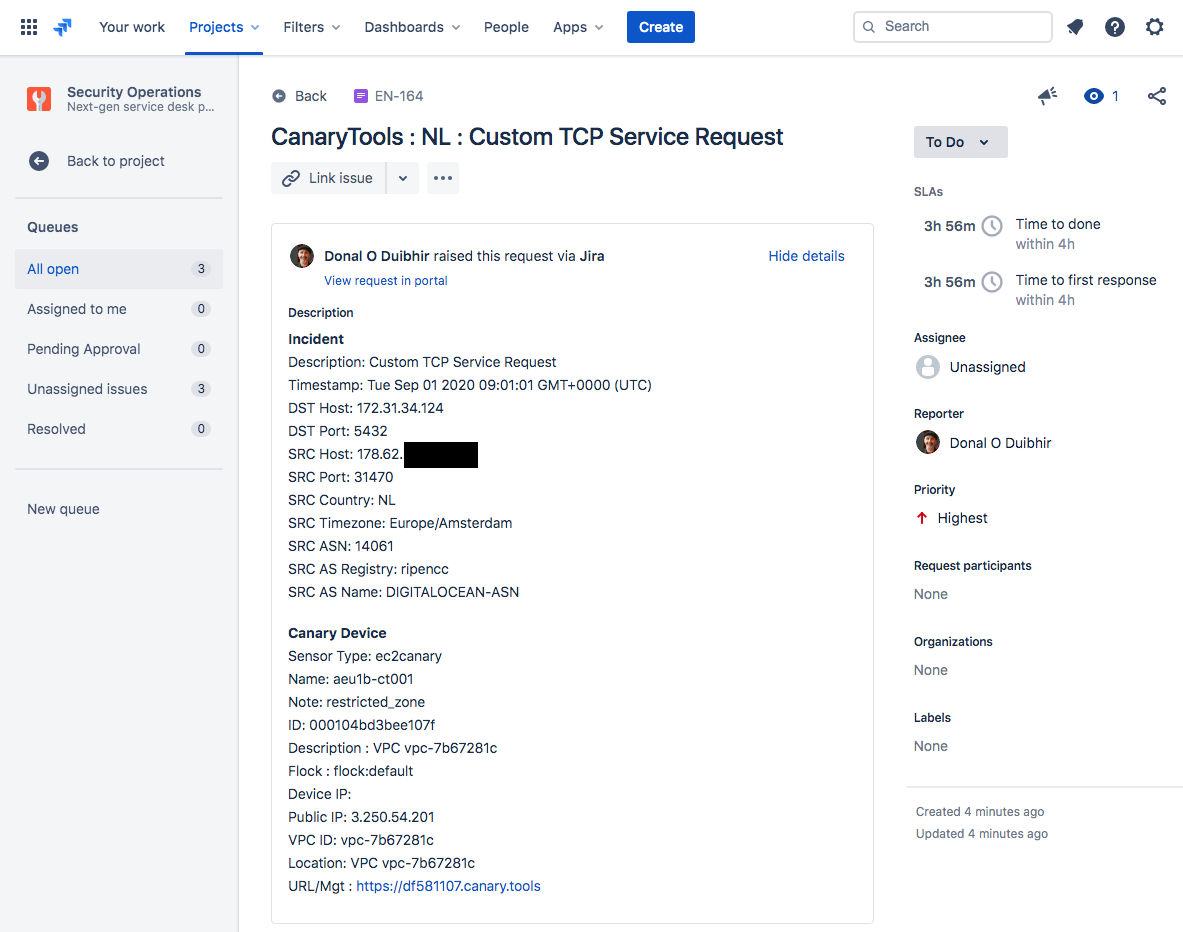
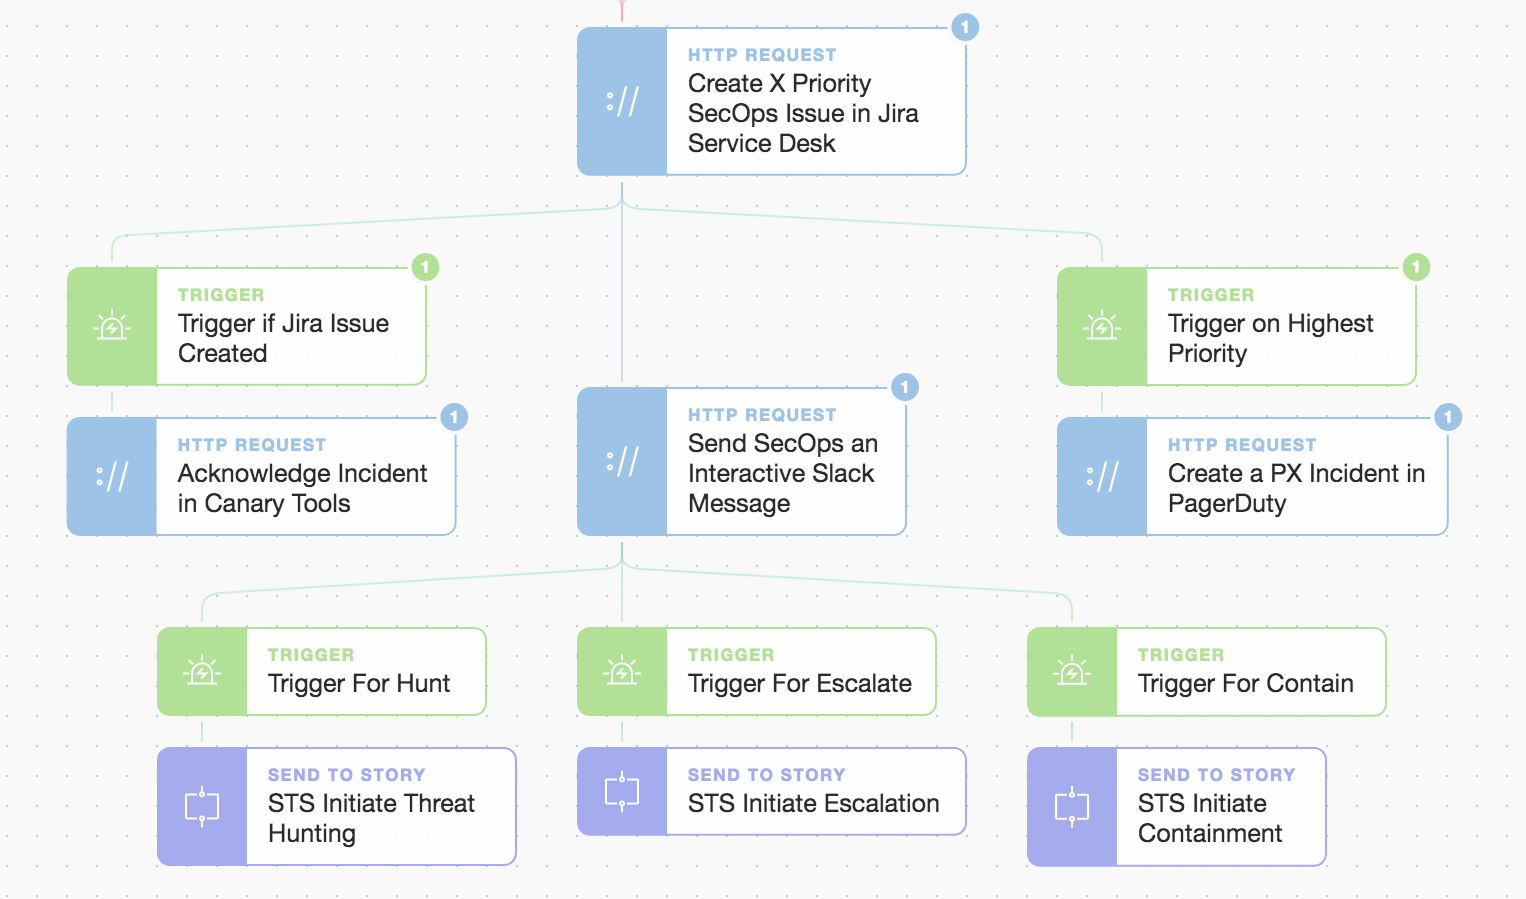
As we are observing lateral traffic in a ‘restricted_zone’ we set the priority to the highest available and then go on to automatically raise and record the issue in Jira.

Capturing our incident in Jira with all the correct attributes inc. priority

We are now tracking the incident in our preferred system of record
Once we’re sure the Jira issue was created we can now acknowledge the Canary Tools incident and our Canary Tools dashboard can return to a peaceful “green” as we move to take further actions.

Deciding what’s next using autonomous interactive prompts for human oversight
We send a customized Slack message to the SecOps ‘Security Team Detections’ channel with action buttons that use simple Tines interactive prompts. They allow us to reintroduce human supervision back into automation workflows and effectively ‘gate’ the next set of modular actions. Do we want to hunt, escalate, or initiate containment around our breach?

Customised Slack interactive incident response!
Let’s click the buttons to “Threat Hunt” and also “Escalate”, but let’s wait a while to “Contain”. We’ve now kicked off two new modular automations in our Story due to our human responses above.

Automatic, consistent, and repeatable SOPs (Standard Operating Procedures) and playbooks
Note: You might have noticed earlier we also automatically paged the on-call SecOps team via PagerDuty (as the incident matched our highest priority classification!). We could also have included our automation prompts (the hunt, escalate, contain) directly in the PagerDuty alert too!
So, have we just caught an attacker (or a hired pen-testing team) without them knowing? Either way, it’s a win for our blue team! If you’d like to read more about automation Stories for threat hunting, escalation, or breach containment, there are lots more examples on the blog… or maybe you might like to download and adapt the automation Story above to check any attacker-supplied logins against the HaveIBeenPwned API?
*Please note we recently updated our terminology. Our "agents" are now known as "Actions," but some visuals might not reflect this.*